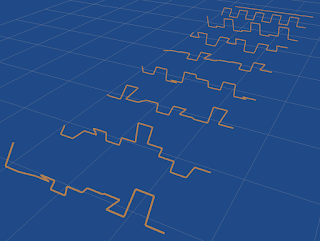
Here I look at the average of discrete repeating signals. That is, I pick random signals (by sorting a random set of values between 0 and the signal length, and using the differences). Then I match the signal to the running average using a cross-correlation, by sliding in time, and optionally reversing the signal direction.
Here are the sequences visualised, from length 1 to 10. One grid cell is 2 units high.
We can also include negative numbers. Each candidate sequence has a sum of absolute values equal to the sequence length. A cross-correlation works equally well, but we can also choose whether to allow negation of the values when matching. Here grid cells are 8 units.
1,3: no reflection, 2,4: reflection. 3,4 includes negation when matching.A different approach is to pick random values between 0 and 1, and match based on minimising sum of square error, rather than maximising cross correlation:
A natural extension of the cross-correlation on signed numbers is to use complex numbers. We cross correlate as the sum of one times the conjugate of the other, and pick the match with the largest real component.
There are more reflection options for complex numbers. We could also negate the value in the reflected match (below left), or conjugate the complex value in the reflected match (below right):
Of the four, it looks like the first two (no-reflect and reflect) give the least trivial result.
We can also use the largest absolute value in the cross-correlation, and so 'rotate' the complex signal when adding it on. This is adding an explicit phase invariance. However, these give more trivial results:
left: no reflection, middle: reflection included, right: reflection with conjugation.
It is not clear that having an even distribution of absolute values is the best constraint on signed and complex values. It may make sense to have an even distribution of signal energy (value squared). Doing so gives results with slightly less spiking and clearer patterns:
I have only shown signal lengths 1 up to 8, as the larger ones become too inaccurate, but the above are repeatable. The no-reflection case, shows a hint of a pattern, with the n=2, 4 and 8 cases close to square waves. and the n=3 and 6 cases being uneven square waves. As for the reflection case, it shows signs of following a saw-tooth wave until about n=6.
Summary:
Of all the above, the most interesting seem to be the simple signed cross-correlations, and the complex cross-correlations. These only have translation symmetry of the signal, and optionally reflection symmetry of the signal. All other symmetries appear to produce more trivial results. Of these, constraining the energy (rather than sum of absolute values) seems to give less random results.
Is there a pattern to these non-trivial signals? Do they follow a function? To they tend to something for large n?


No comments:
Post a Comment